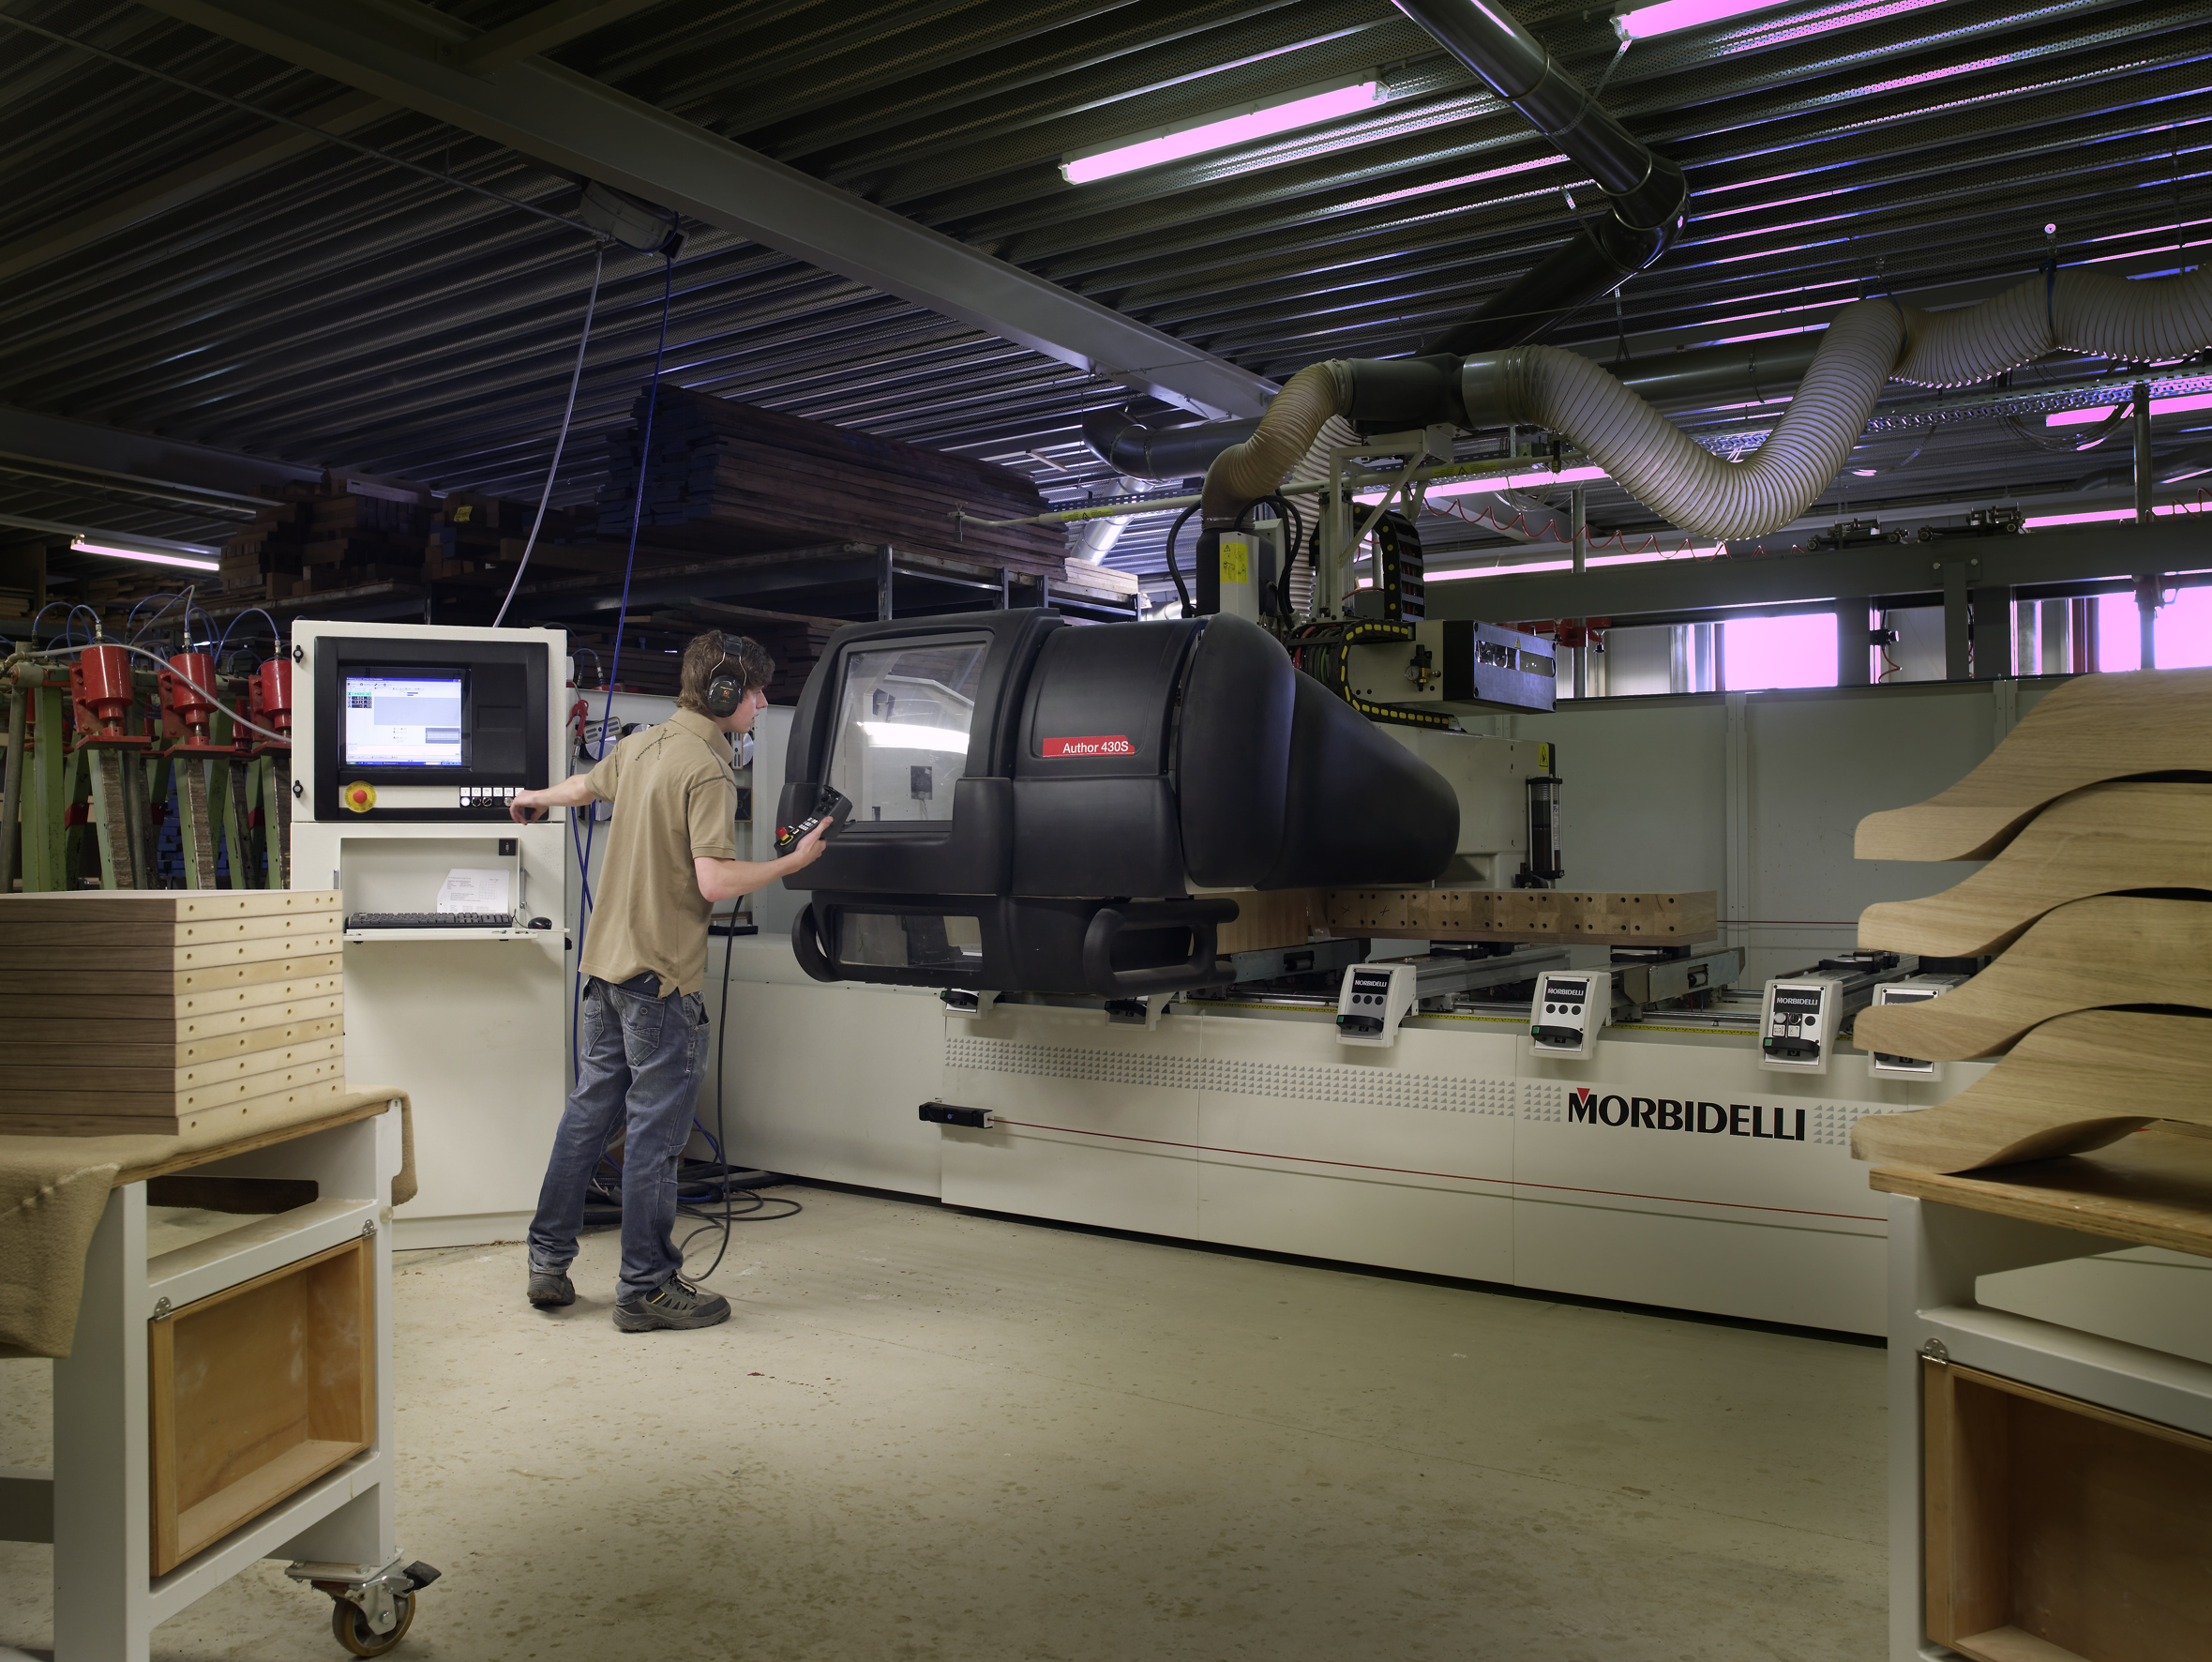
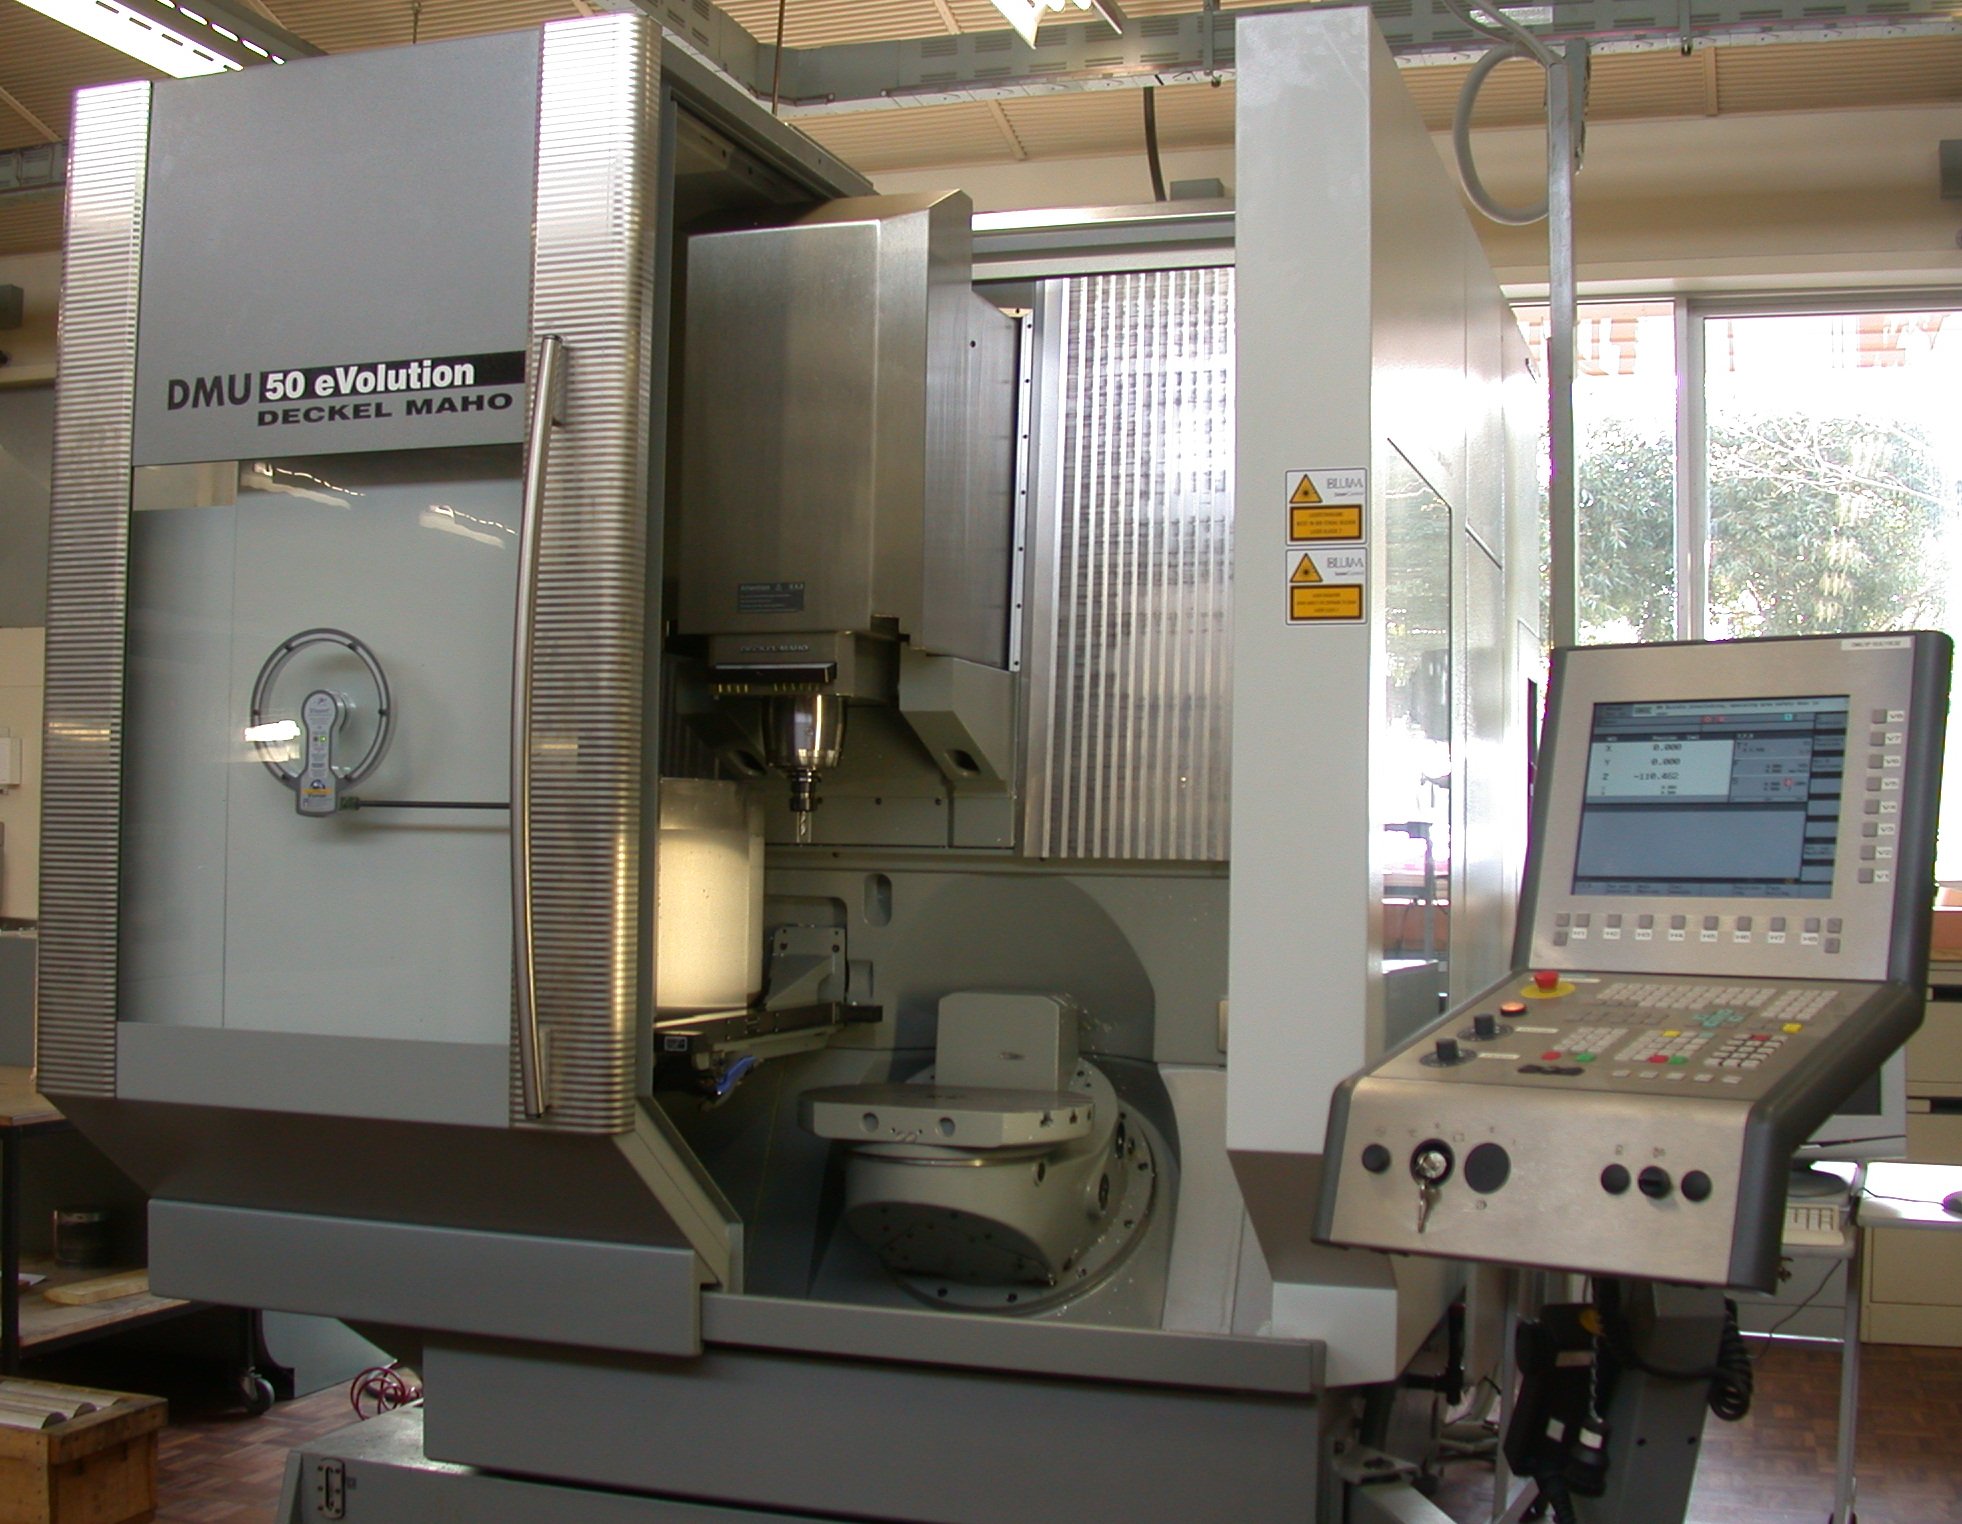
Demo day can make almost any process look ready for production; the scorecard is what tells you whether it actually is.
When I watch a micro CBN high-speed finishing demo, I am usually asking the same four questions: Does the finish hold up under measurement, or only under showroom lighting? Does the process stay stable after the first good part? How much setup labor is hiding behind the nice result? And can this run on your machine, your fixture, and your clock, not just on the vendor’s best day?
This matters because finish quality is not a mood, and tool behavior is not a brochure. Sandvik Coromant’s milling troubleshooting guidance points straight at tool wear, holder run-out, clamping, and vibration as everyday sources of variation, while Mitutoyo’s metrology material shows why traceable roughness measurement is what turns a promising surface into a defensible production result. If you want broader context on the service side of this site, the homepage and services page are the cleanest starting points.
In the article below, I’ll show you how to rate a demo on a 1-to-5 scorecard, what evidence to collect while the machine is running, and where a process that looks elegant in the booth usually breaks when it meets production reality. If you want more articles like this, keep an eye on the blog index; if you already know you need a follow-up conversation, the contact page is the right next move.
Why demos feel convincing, and why you still need a scorecard
A good demo has a lot going for it. The part looks clean. The operator sounds certain. The surface finish sounds expensive. The machine is tuned, the fixture is dialed in, and the only thing missing is the tension of a real production schedule.
That is exactly why demos can mislead. They compress the ugly parts of production into a short, polished performance. They usually remove the weakest link in the chain: inconsistent workholding, minor tool wear, operator variation, heat soak, chip buildup, or the simple fact that the first part of the day is rarely the hardest one. A scorecard gives you a way to separate “impressive” from “repeatable.”
I like to treat the demo as a controlled sample, not as proof. The question is not “Did it work once?” The question is “What would have to stay true for this to keep working after the booth lights are off?”
That is also why measurement discipline matters. Mitutoyo’s surface-finish material and case studies keep circling the same point: if you want a finish to mean something, you need a repeatable way to inspect it, record it, and compare it against a known baseline. A nice-looking sample without a method is just a nice-looking sample.
The scorecard: what to rate and what evidence to collect
I score each category from 1 to 5, where 1 means the demo does not show production promise and 5 means the result looks repeatable, measurable, and operationally honest.
| Category | What you are really testing | Score 1 | Score 3 | Score 5 | Evidence to collect |
|---|---|---|---|---|---|
| Finish quality | Surface texture, edge condition, burrs, transfer, and measurement method | Looks good at a distance; measurements are vague | Acceptable finish with a few rough edges | Measured finish, consistent edges, no surprise cleanup work | Ra/Rz values, photos, measurement locations, part comparison notes |
| Process stability | Run-to-run consistency, wear behavior, and downtime risk | One good part, then drift or rework | Stable for a short run, unclear over time | Multiple parts with the same result and no drama | Part-to-part readings, tool life notes, alarm history, operator comments |
| Tooling behavior | Chip evacuation, tool load feel, and runout sensitivity | Chatter, packing, or obvious sensitivity | Manageable with careful tuning | Predictable behavior and forgiving setup | Video, chip photos, holder details, runout check, load observations |
| Setup effort | Workholding repeatability, probing, zeroing, and changeover time | Setup is a hand-built ritual | Setup is possible but slow | Setup is repeatable and quick | Setup time, touch-off steps, fixture notes, re-zero method |
| Throughput | Real cycle time, not demo-time marketing math | Marketing number only | Close, but with caveats | Measured cycle time on a realistic part | Start/stop times, part count, operator involvement, changeover impact |
| Practical constraints | Coolant or air strategy, machine capability, fixturing limits | Works only in a lab-like setup | Works if conditions are narrow | Fits ordinary shop constraints | Machine spec notes, coolant setup, fixture limits, process dependencies |
| Documentation readiness | Parameter notes, tooling specs, and support availability | “We’ll send something later” | Partial notes, partial support | Enough detail to repeat the process without guesswork | Cut data, holder data, revision notes, support contact path |
Below the table, keep a one-line note for each category: what you saw, what you measured, what you would need to verify in a trial, and what would kill the idea immediately. That is the difference between a demo notebook and a decision tool.
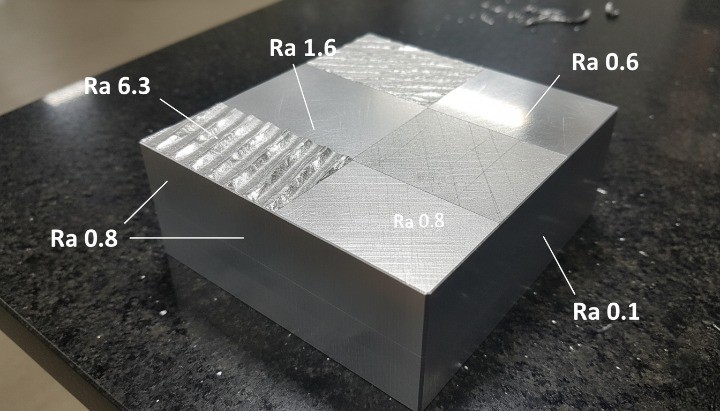
1) Finish quality: surface texture, edge quality, burr transfer, measurement method
Finish quality is where demos usually win the first impression battle. A part with a clean sheen and crisp edges can convince a room in ten seconds. That is fine, as long as you know what you are measuring.
I rate finish quality on four subquestions:
- Does the surface texture match the requirement, not just the eye test?
- Are the edges clean, or do they need secondary cleanup?
- Is there burr formation, smear, transfer, or edge pullout?
- Was the finish measured with a repeatable method and a defined location?
Example: if a demo part comes off the machine with a beautiful center area but the entry and exit edges show transfer, I do not call that a 5. I call it a 3 that needs a correction path. The middle of the part is not the whole part. The corners are where reality usually sits down and opens a beer.
Another example: if the exhibitor shows a roughness number but cannot tell you where it was measured, which cut direction was used, or how the part was cleaned before inspection, the result is not production-grade evidence. It is a number in search of a process.
Use the same measuring method for every demo. If one booth gives you a roughness tester reading, another gives you a surface comparator, and a third only gives visual judgment, you are not comparing processes. You are comparing measurement discipline. For a useful refresher on why roughness measurement matters, Mitutoyo’s surface-finish case study is a good example of the kind of traceability that moves a result from “looks fine” to “can be audited later.”
A practical finish-quality score looks like this:
- 1: visible defects, unclear method, or heavy cleanup required.
- 3: acceptable finish in the flat area, but edge behavior or measurement method is incomplete.
- 5: measured finish, repeatable across parts, with no hidden secondary work.
When you leave the booth, you should know exactly which surface was measured, which edge was checked, and what “good” means in the language of the final spec. If you cannot write that down in one sentence, the demo is not ready for a go/no-go decision.
2) Process stability: run-to-run consistency, tool wear indicators, downtime risk
Stable processes are boring. That is the point. They do not demand emotional support, surprise adjustments, or a lucky operator. They do the same thing again and again.
To score stability, I look for three things:
- Do the first, middle, and last parts hold the same finish and edge quality?
- Does the tool show wear in a predictable way, or does the finish drift suddenly?
- Does the process depend on the application engineer hovering nearby?
Sandvik Coromant’s milling troubleshooting materials are useful here because they keep pointing back to the same failure modes: tool wear, holder run-out, poor clamping, and vibration. In production, those are not “edge cases.” They are the plot. If the demo only works because every variable is held in a museum-grade state, that is not stability. That is staging.
One practical test is simple: ask for three consecutive parts with no hidden intervention. Do not reset the setup between parts unless the real process would require that. If the first part is great, the second is decent, and the third is already drifting, the score is not a 5. It is a warning.
Downtime risk matters too. A process can make a beautiful part and still be a poor production choice if it requires frequent pauses for chip clearing, tool replacement, or parameter nudging. A demo that needs constant human correction is usually telling you the future before you ask.
Suggested score pattern:
- 1: part quality changes quickly, and no one can explain why.
- 3: short-run consistency is decent, but wear and downtime risk are still open questions.
- 5: multiple parts match, wear is visible and understandable, and the process does not need babysitting.
3) Tooling behavior: chip evacuation, tool load feel, runout sensitivity
Micro CBN finishing can be elegant when the tooling behaves. It can also become a tiny, expensive argument between a tool and a chip.
There are three things I watch closely:
- Chip evacuation: Do chips leave the cut cleanly, or do they pack, recut, or smear?
- Tool load feel: Does the spindle sound steady, or does the operator keep saying “that feels better now”?
- Runout sensitivity: Does a small holder or spindle variation change the finish noticeably?
Sandvik Coromant’s vibration guidance is a useful sanity check because it keeps tying process quality back to tool stability and smallest run-out. That is the right mental model. A process that is hypersensitive to tiny runout changes might still produce good samples, but it is not forgiving enough for everyday production unless the machine, holder, and fixture stack are all equally disciplined.
Example: if chip evacuation requires constant air blast to keep the surface clean, I want to know whether that air strategy is part of the process or just a demo convenience. If the finish deteriorates the moment chip clearing changes, then the process is fragile. Fragile processes are the ones that look fine on a short clip and then become full-time maintenance hobbies.
Another example: if the tool load feels light but the edge quality falls apart when runout changes by a hair, the process is probably too sensitive for your shop’s normal variance. In that case, the score should stay at 3 until you have a holder, spindle, and setup method that can reproduce the same result without heroic alignment.
Score it this way:
- 1: chips pack, load changes are obvious, and runout sensitivity is high.
- 3: behavior is manageable but clearly setup-sensitive.
- 5: chips clear cleanly, load stays even, and small setup variation does not wreck the finish.
At this stage, I also want a clean record of the toolholder, overhang, clamping method, and any special coolant or air arrangement used during the demo. If the booth cannot tell you those basics, you are not evaluating a process. You are admiring a stage prop.
4) Setup effort: workholding repeatability, probing and zeroing, changeover time
Setup effort is where many “great demo” processes quietly lose their production case. If the setup takes an hour and the cut takes five minutes, the economics start making facial expressions.
I break setup effort into three questions:
- Can the workholding be repeated without a fresh puzzle every time?
- Does probing or zeroing produce the same reference point on each setup?
- How long does the changeover actually take once the booth assistant steps away?
Workholding repeatability is the big one. If the part shifts by a few microns every time it is clamped, the tool path may be perfect and the result still inconsistent. That is not a tool problem. It is a system problem.
Probing and zeroing matter for the same reason. A neat setup procedure that only one person can perform is not a procedure; it is a talent show. I want to see the reference strategy, the check points, and the tolerance for operator variation.
Changeover time is where the real friction shows up. Ask the demo team to describe the full sequence from part out to part in, including inspection, cleanup, and any parameter reset. If the answer is vague, time it yourself. Once you have a realistic changeover number, compare it to the claimed cycle time. That is usually where the brochure starts sweating.
This is also the part of the process where documentation becomes operational. If your team needs the handoff to turn into a tracked workflow instead of another folder of notes, a third-party work order management software builder is one way to structure that transition. The point is not the tool name. The point is making sure the follow-up is visible, assigned, and measurable.
Score guide:
- 1: workholding is fiddly, zeroing is fragile, and changeover is slow.
- 3: the setup works, but only with attention and practice.
- 5: the setup is repeatable, documented, and not dependent on one expert standing nearby.
5) Throughput and cycle time: realistic part time versus marketing numbers
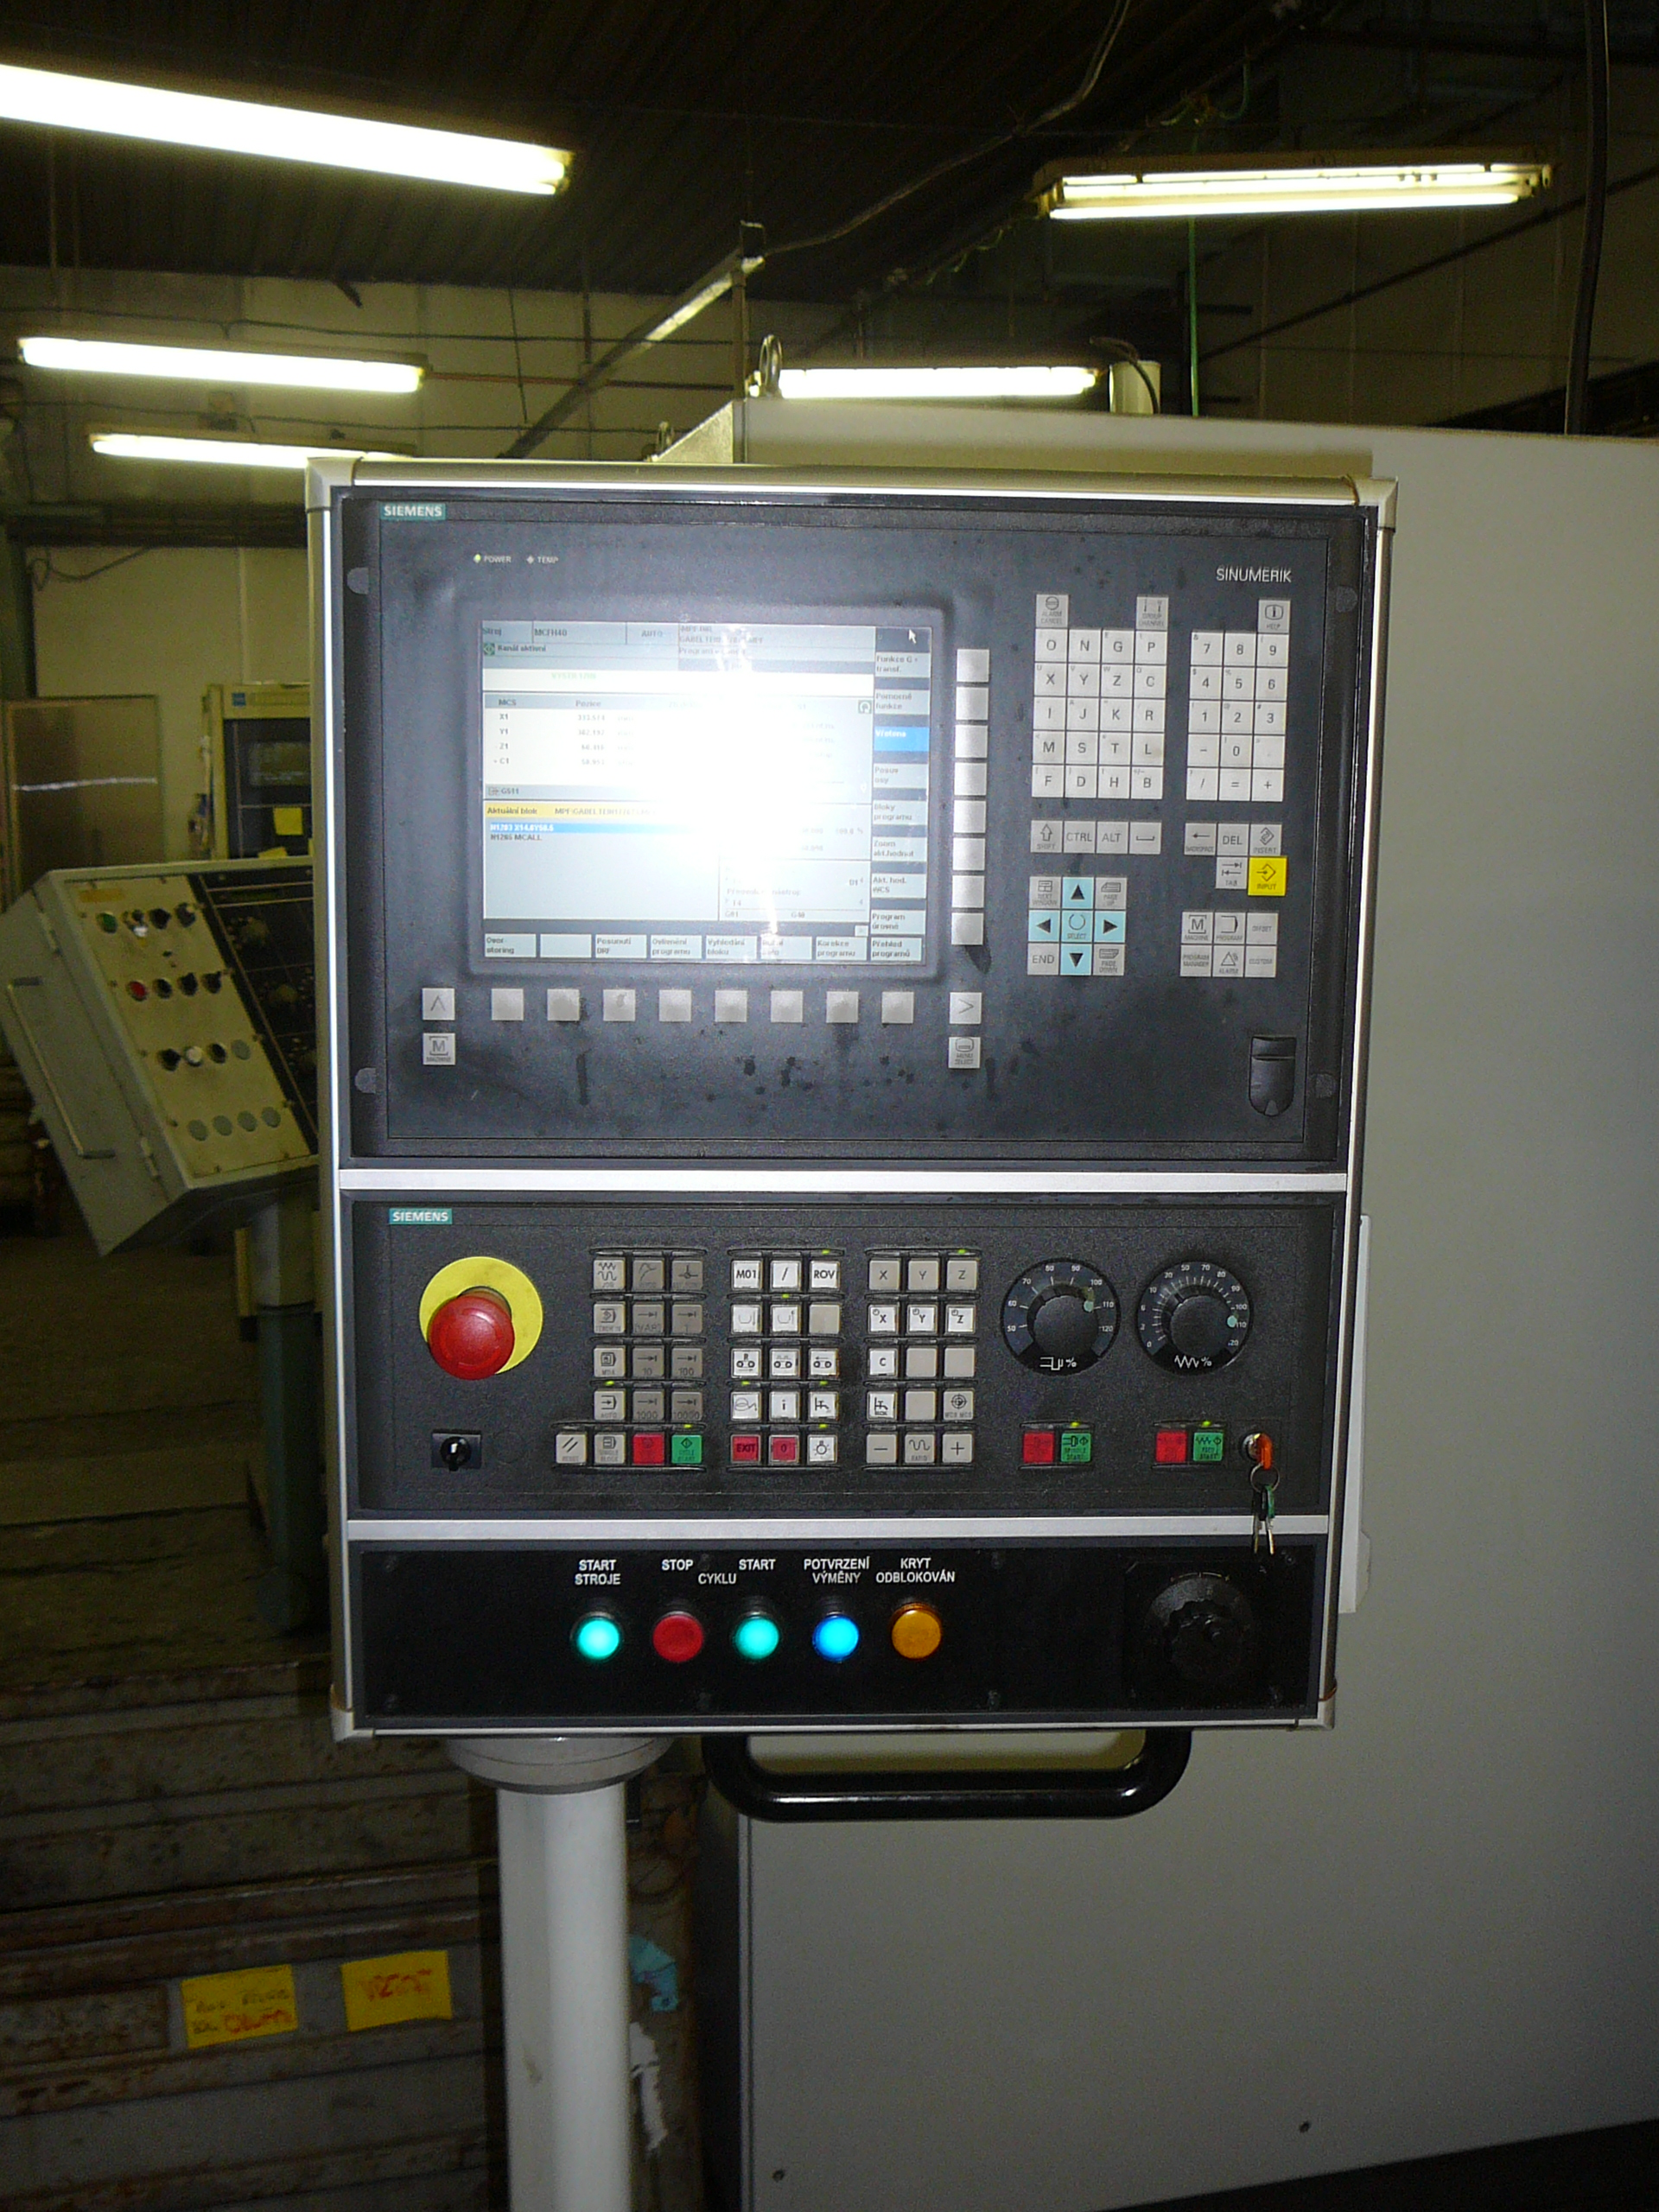
Throughput is where common sense should carry a clipboard.
Marketing cycle times usually assume a perfect setup, a clean machine, a favorable part geometry, an attentive operator, and no interruptions. Production does not usually share those assumptions. Production likes queues, changeovers, inspection waits, tool changes, and the occasional machine that decides it would rather be a sculpture.
To score throughput honestly, compare four numbers:
- the advertised cycle time,
- the observed demo cycle time,
- the first-part cycle time after setup, and
- the cycle time after the process has been run long enough to warm up.
Those numbers are rarely identical. That is fine. What matters is the gap. If the demo promises a 40-second cycle and your realistic trial suggests 72 seconds plus a 6-minute changeover, the decision is not “the vendor lied.” The decision is “the process has a different operating profile than the demo suggests.” That is useful information.
A practical way to read throughput is to ask whether the process scales without hidden labor. If a fast cycle requires constant inspection, frequent resets, or a highly specialized operator, the throughput is not really fast. It is merely compressed somewhere else.
Score guide:
- 1: the claimed speed is not observable in a real setup.
- 3: the cycle is plausible but still needs proof under real constraints.
- 5: the observed cycle time is consistent, realistic, and not propped up by extra labor.
6) Practical constraints: coolant or air strategy, machine capability, fixturing limits
Practical constraints are the part of the scorecard that keeps the engineer honest. They are also the part that marketing usually hopes you will skip.
Here I test three realities:
- Coolant or air strategy: Does the process depend on flood coolant, directed air, mist, or a special delivery method?
- Machine capability: Does your spindle, acceleration, rigidity, and thermal behavior resemble the demo machine?
- Fixturing limits: Can your normal fixture hold the part with the same repeatability and stiffness?
If the demo process only works with a very specific cooling arrangement, and your shop cannot support that arrangement, the process may not be production-ready for you. Same for spindle capability. A machine that is excellent at one style of finishing may still be the wrong machine for another if the thermal and dynamic behavior are not close enough.
Fixturing is often underestimated. A beautiful toolpath on a weak fixture is like a good speech on a collapsing stage. The geometry may be right, but the supporting structure is wrong.
Ask whether the demo part would still meet spec if the part were larger, if the fixture were less exotic, or if the machine were not fully warmed up. If the answer is “probably not,” score the process accordingly and treat the demo as a learning sample, not a production candidate.
Score guide:
- 1: the process depends on conditions your shop does not have.
- 3: the process is possible, but only within a narrow envelope.
- 5: the process fits normal shop constraints without heroic support.
7) Documentation readiness: parameter notes, tooling specs, and support availability
Documentation readiness is where the demo either becomes a transferable process or disappears into someone’s memory. If you cannot recreate it six weeks later, you do not own the process yet.
At minimum, I want these notes before I call the demo production-friendly:
- material and part geometry class,
- tooling specification and holder details,
- overhang and clamping method,
- feeds, speeds, and step-over or step-down logic,
- coolant or air arrangement,
- measurement method and roughness target,
- tool wear or replacement guidance, and
- a real support contact path if the process drifts.
Also ask what is missing. That question matters more than it sounds. If the vendor cannot explain the sensitive variables, the boundary conditions, and the expected failure modes, the process is still undocumented in the only way that counts: operationally.
A clean score here means the process comes with enough detail to repeat, troubleshoot, and hand off. A weak score means the process depends on one expert, one setup, and one lucky afternoon.
Score guide:
- 1: notes are thin and support is informal.
- 3: there is enough information to try a pilot, but not enough to trust scale-up.
- 5: the package is complete enough to repeat and support the process without guesswork.
For teams that want the handoff to become a repeatable operating workflow, not just a note on a laptop, the distinction is the same one every serious process team eventually makes: either the work is tracked, or it is folklore.
How to turn the score into a decision
I do not treat the total score as a magic number. I treat it as a decision map. A process with one weak section can still be worth a trial if the weakness is fixable. A process with four mediocre sections usually wants more development before it wants a purchase order.
Here is a simple threshold model I use:
| Total score | What it usually means | Suggested action |
|---|---|---|
| 30-35 | Strong fit with manageable risk | Move to a controlled production trial on your own parts |
| 23-29 | Promising, but still conditional | Pilot only if the weak points have a clear corrective plan |
| Below 23 | The demo is interesting, but not yet production-ready | Keep evaluating; do not confuse a nice sample with a stable process |
One caution: a high total score does not excuse a fatal flaw. If finish quality is excellent but the process depends on a coolant arrangement you cannot support, that is still a problem. If throughput looks great but setup effort takes half a shift, that is still a problem. A scorecard works because it keeps the tradeoffs visible.
The right question after scoring is simple: what would have to change before this could run on my parts, in my machine, with my people, on a Tuesday morning? If the answer is “not much,” you probably have a trial candidate. If the answer is “almost everything,” you have a demo, not a plan.
What to request before you leave the booth
Before you walk away, ask for a compact packet. Not a sales brochure. A packet.
- the exact part or test geometry used in the demo,
- the measurement method for finish and edge quality,
- tooling part numbers and holder details,
- feeds, speeds, depth, and any parameter ranges that mattered,
- the coolant or air strategy,
- notes on tool wear or replacement intervals,
- the machine capability assumptions that mattered, and
- one real person who can answer follow-up questions after the event.
Then write your own note on top of theirs: what happened, what looked robust, what still needs proof, and what would stop the project immediately. That one paragraph is often more valuable than the whole stack of brochures.
If you can, save the scorecard in the same folder as your part drawing, inspection notes, and demo photos. That way, when the team compares options later, the context is still attached to the decision. Process memory is a useful thing; undocumented process memory is how shops end up re-learning the same lesson in different shoes.
Close
Micro CBN high-speed finishing can be a strong production move, but only when the demo proves more than one pretty part. The scorecard is the difference between a technical impression and a defensible decision. It forces the conversation onto finish quality, stability, tooling behavior, setup effort, throughput, practical constraints, and documentation readiness.
My short version is this: if the process cannot be measured, repeated, supported, and transferred, it is not ready yet. If it can do those four things, you have something worth trialing on your own parts.
If you want to keep building the decision from here, start with the blog for related planning articles, review the services page for broader support context, or use the contact page to turn the scorecard into a concrete follow-up. The homepage is still the fastest way to reorient the broader site if you need it.